Why p95 Doesn't Always Mean What You Think It Means
Percentiles are everywhere: dashboards, SLOs, alert pages, standups. They feel intuitive and precise.
p95 latency is 120ms. Seems clear enough. 95% of requests are faster than 120ms. 5% are slower. You know exactly where the tail starts.
But there’s a subtle problem. It shows up when you ask: where does that 120ms actually come from?
How Histograms Work
Most monitoring systems don’t store every latency value. That would be expensive. Instead, they use histograms.
A histogram divides latency into buckets. Each bucket covers a range. The system counts how many requests fall into each range.
0-10ms:     1,200 requests
10-50ms:    3,400 requests
50-100ms:   800 requests
100-250ms:  150 requests
250-500ms:  40 requests
500ms+:     10 requests
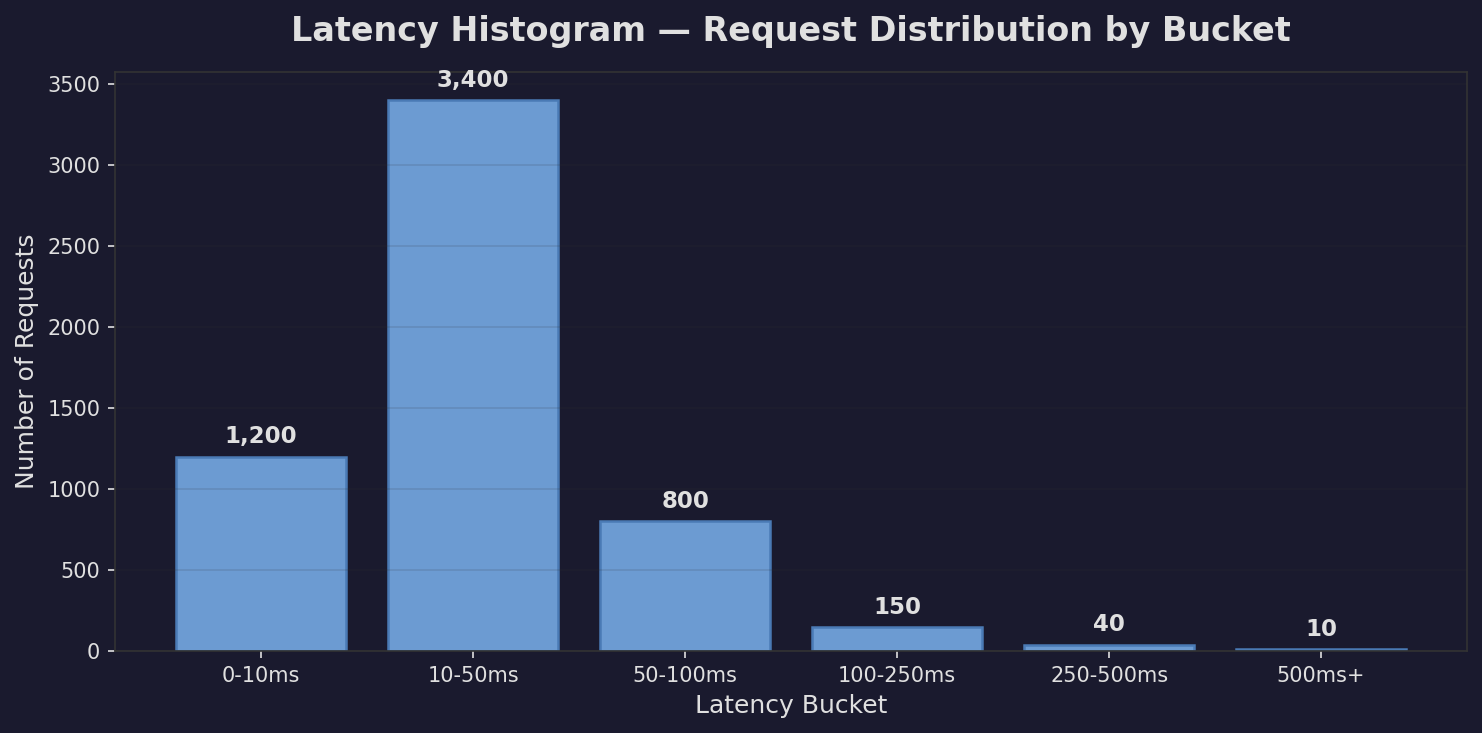
Notice something. We know 150 requests took between 100ms and 250ms. But we don’t know their exact values. Were they 101ms? 249ms? The histogram doesn’t say.
Computing p95 From Buckets
Let’s use the histogram from above. We have 5,600 total requests. To find p95, we need the value where 95% of requests are faster.
95% of 5,600 = 5,320 requests.
So we’re looking for: what latency is the 5,320th request?
We walk through buckets, counting:
- 0-10ms has 1,200 requests. Running total: 1,200.
- 10-50ms has 3,400 requests. Running total: 4,600.
- 50-100ms has 800 requests. Running total: 5,400.
Somewhere in that third bucket, we crossed 5,320. So p95 is in the 50-100ms range.
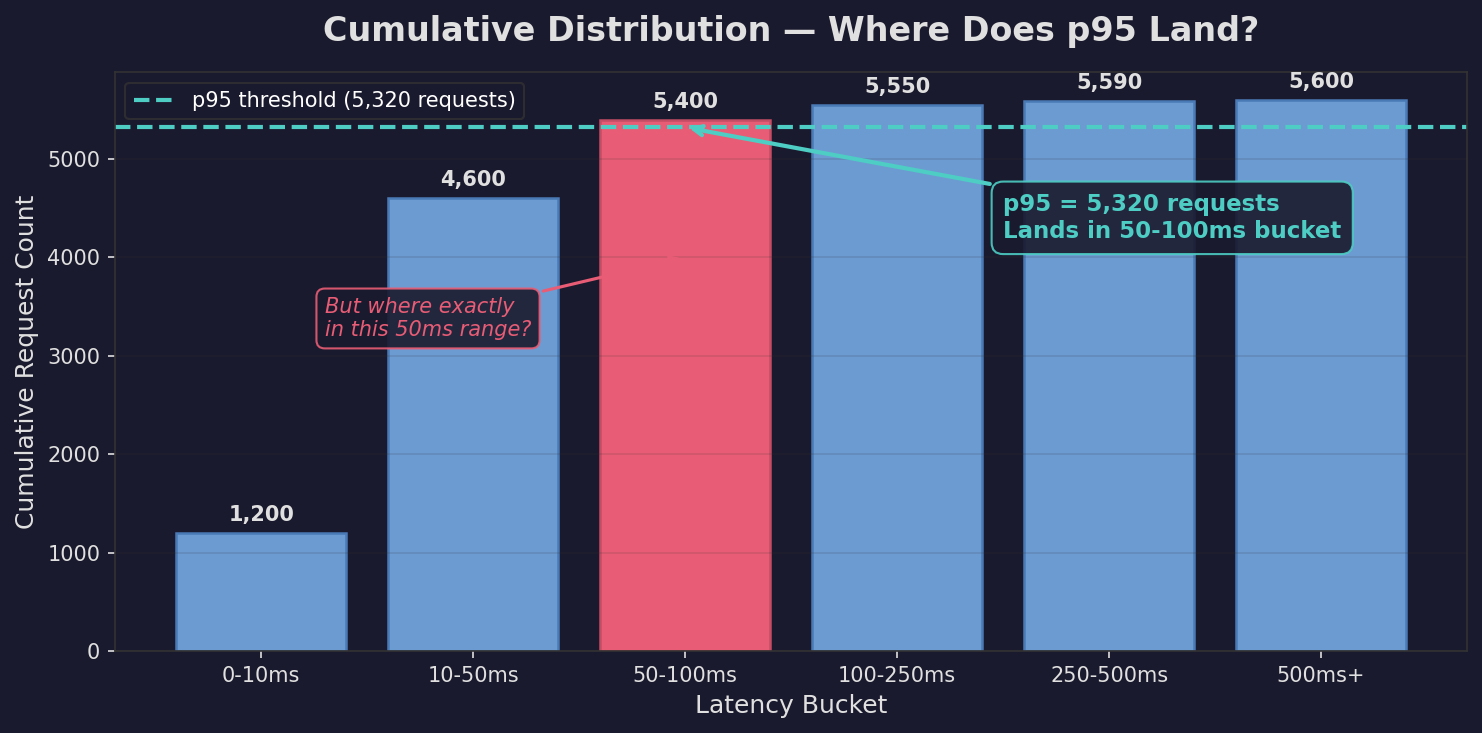
But where exactly in that range? 51ms? 99ms? We don’t know. The histogram doesn’t store individual values. So we pick something — maybe the midpoint, maybe we interpolate.
If the bucket is narrow, our guess is close enough. If the bucket is wide, we could be way off.
The Unbounded Bucket Problem
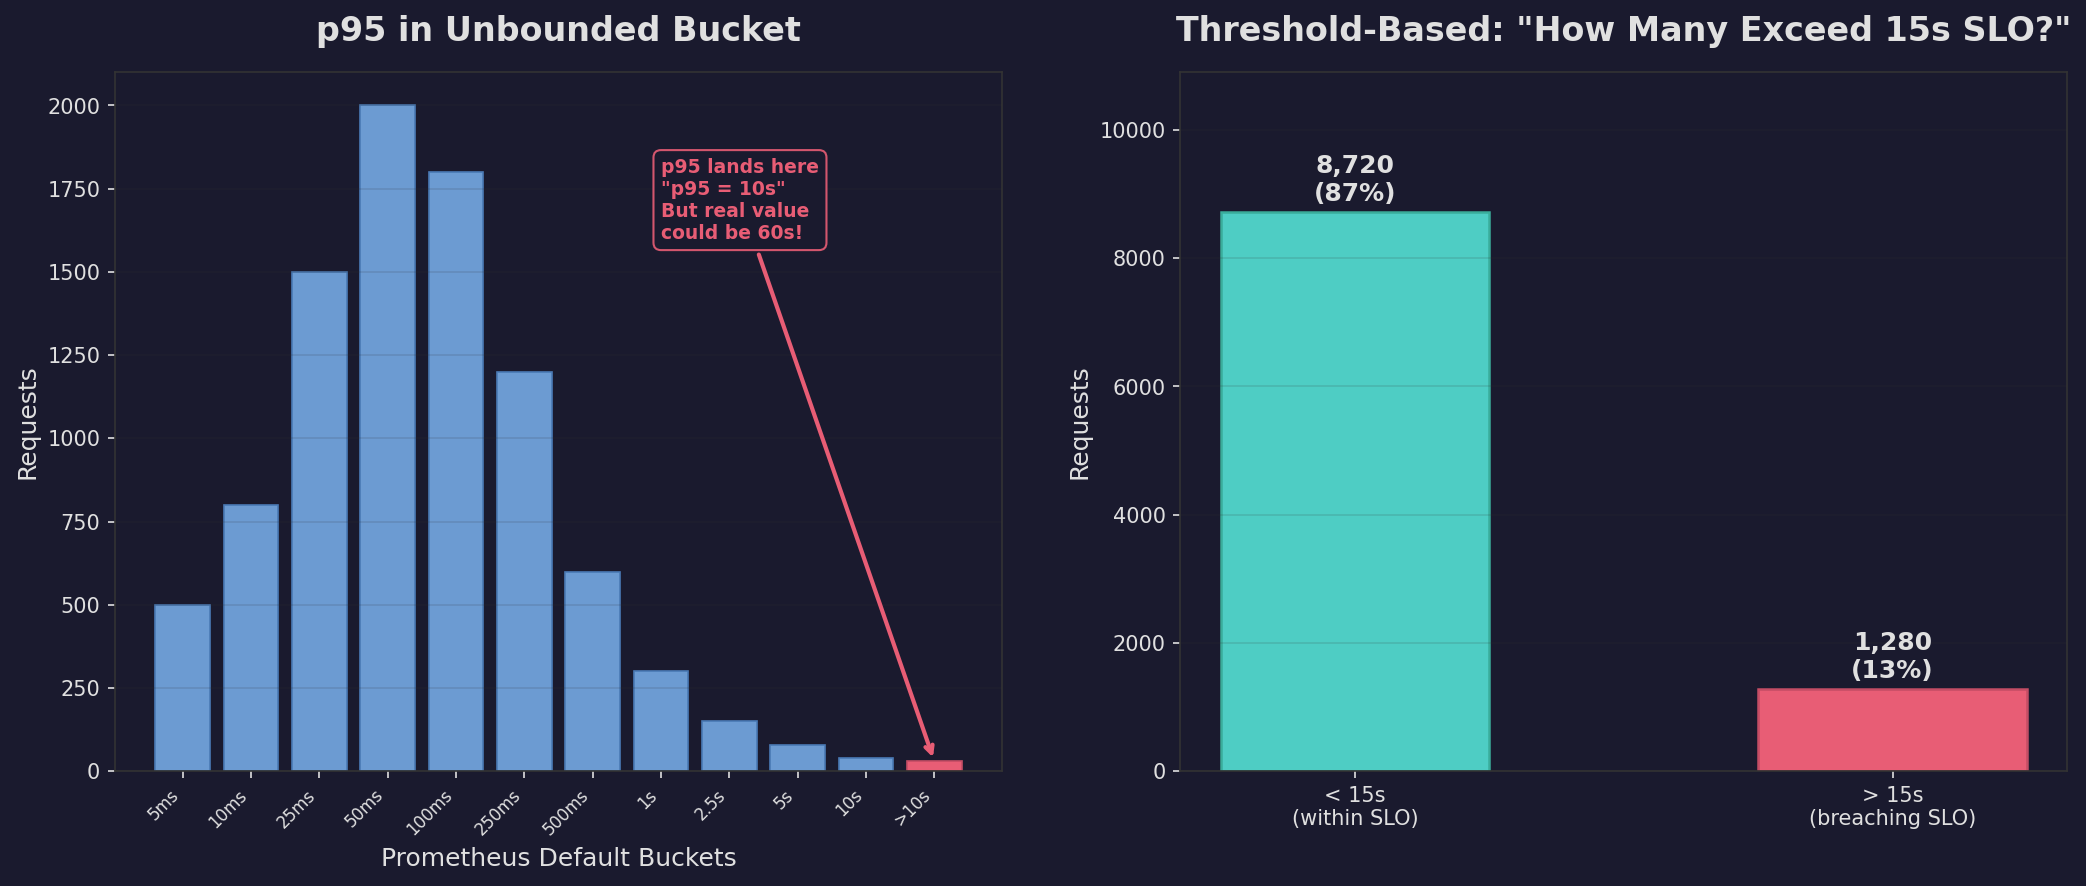
Now look at a common default configuration in Prometheus:
[0.005, 0.01, 0.025, 0.05, 0.1, 0.25, 0.5, 1, 2.5, 5, 10]
That last bucket catches everything above 10 seconds. No upper bound.
If p95 lands there, the dashboard shows “p95 = 10s”. But what does that actually mean?
You still know that 5% of requests are slower than 10 seconds. That part is true. But the value — the 10s — is just the bucket boundary. The real p95 could be 11 seconds or 60 seconds. You can’t tell.
The percentage is accurate. The value is meaningless.
Who Picks the Threshold?
Here’s the real issue. With p95, the data picks your threshold. Whatever value lands at the 95th position becomes the number you report.
But that might not be the threshold you actually care about.
Say your latencies range from 0 to 60 seconds. Your p95 comes out to 20 seconds. That tells you 5% of requests are slower than 20s.
But here’s the thing — you don’t care about 20 seconds. Your SLO says users should get a response within 15 seconds. That’s the threshold that matters.
p95 being 20s doesn’t tell you how many users are breaching your 15s SLO. It tells you where the 95th percentile happens to land.
There’s another approach: you pick the threshold.
Instead of asking “what’s p95?”, ask: “what percentage of requests exceed 15 seconds?”
Now you’re measuring what actually matters. Maybe it’s 8%. Maybe it’s 12%. Either way, you know exactly how many users are having a bad experience by your definition of bad.
The Difference
With p95, you’re asking: “Where does the slowest 5% begin?”
With a threshold-based approach, you’re asking: “How many requests exceed this threshold I care about?”
Both tell you something about the tail. But p95 lets the data choose an arbitrary cutoff point. Picking your own threshold lets you choose a meaningful one.
And here’s the thing — when p95 falls in a well-defined bucket, it is meaningful. You get a real latency value that tells you where the tail starts.
But when it falls in a wide or unbounded bucket, you’re left with a bucket boundary pretending to be a latency. The 5% is real. The value isn’t.
The Takeaway
p95 is a fine metric when your histogram has good resolution around the tail. When it doesn’t, the value you see might just be the edge of a bucket.
Next time you’re looking at p95, ask: do I know what bucket that came from? If it’s the unbounded one, consider flipping the question. Instead of “where is the 95th percentile?”, ask “how many requests exceed my SLO?”
That question always has a meaningful answer.
This post came out of a conversation with Ranjan.